
Operational metrics of customer success for software implementations show progress over time and drive financial success over the long term. What gets measured gets fixed. The trend is more important than the numbers. Here are some feasible and useful quarterly metrics:
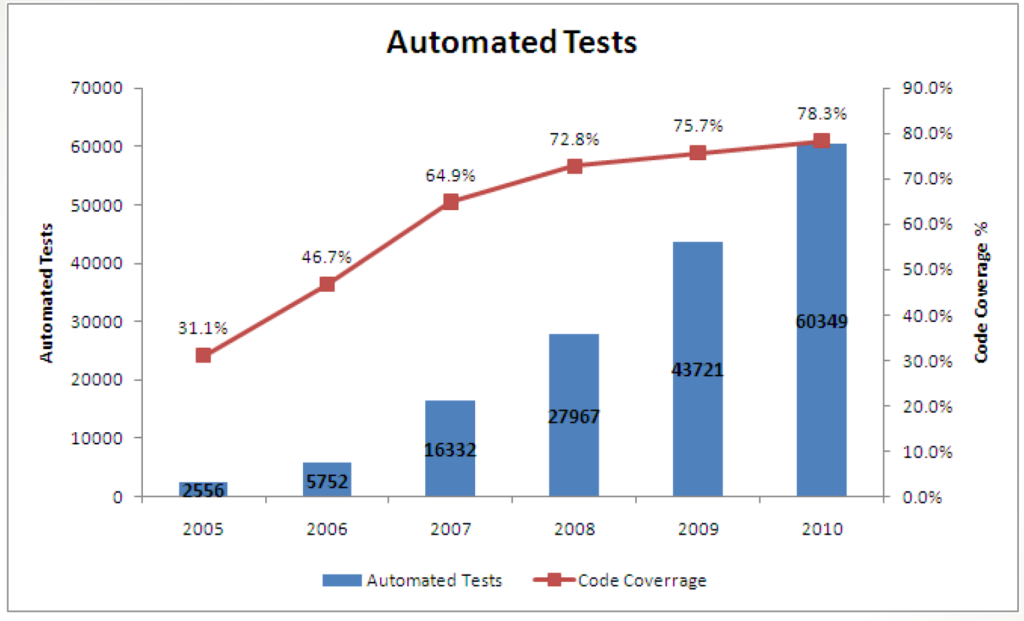
Percent of all tests that have been automated – This is a direct financial driver and one to which a company needs to commit resources constantly. Increasing is better. The following example shows progress from 2005 to 2010 at Salesforce.com:
Number of unplanned production incidents – This should be decreasing over time and is a direct measure of quality. Decreasing is better.
Weighted number/severity of exceptions discovered in testing – this is a direct measure of quality of the software development process. Decreasing is better.
Weighted number and time to resolve production incidents – decreasing is better.
Ticket close rate – increasing is usually better.
Weighted number and severity of open tickets – decreasing is better.
Weighted severity, number, and time to respond – measures the time it takes to recover from a failure as measured from the time when you were first alerted to the problem as weighted by severity. Decreasing is better.
Time to failure – increasing is better. As usual this can be weighted by severity.
Lead time – this measures the time between placing a feature on the roadmap and when it gets delivered. Related: Faithful fulfillment of roadmap commitments.
Customer acquisition cost – The trend will indicate scale efficiency and leverage. Decreasing is better.
Customer retention rate and Churn rate – these apply mostly to software subscription customers but can also be relevant to companies with services as well as products.
The “lead-to-customer conversion” rate – The number of leads that convert to paying customers.